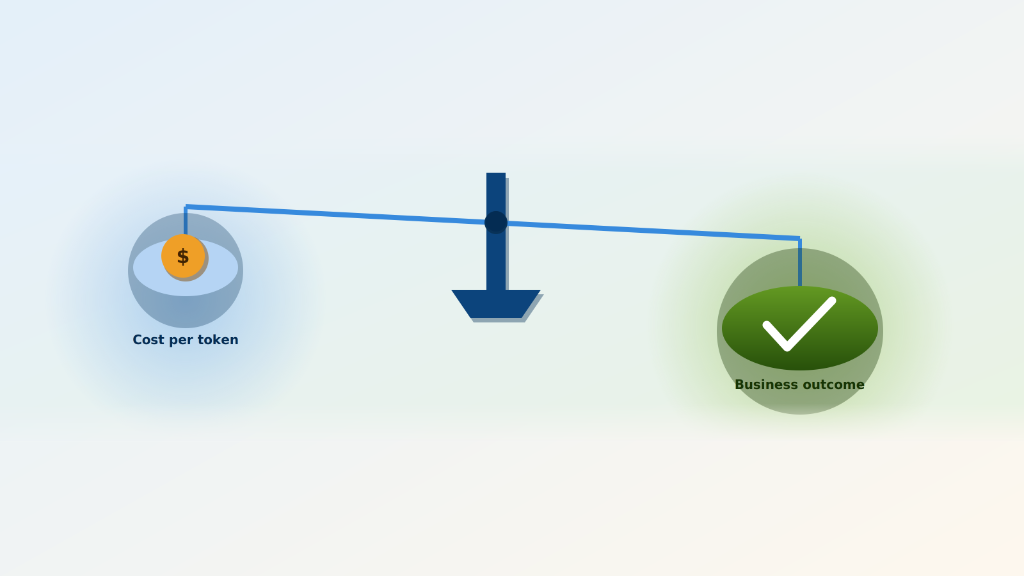
Cloud bills are rarely random. Every line item is an engineering decision translated into dollars, an autoscaling policy, a query pattern, a deployment topology, priced out and itemized weeks after the decision actually shipped. Cloud cost optimization means reading the decision behind the number, not just the number itself.
Key Takeaways
- Cost signatures show up in architecture, deployment, and scaling choices alike.
- A cost spike can be traced back to a decision, much like a bug is traced through a stack trace.
- Consolidating chatty services can lower both cost and on-call load together.
- The tool used to run a query can matter as much as the query itself.
- Cloud spend efficiency is a growing industry focus, with waste reaching 29% of spend in 2026.
- Rightsizing tools make it easy to catch resources that are bigger than they need to be.
- Routing a cost anomaly to the right owner is often the more useful step.
- Cost literacy is a simple, valuable skill for any engineering team to build.
That decision-to-invoice gap behaves like a slow memory leak. A leak doesn't crash the process at the line of code that allocates memory without freeing it, it crashes hours later, when accumulated allocations finally exhaust the available heap.
A costly architecture decision works the same way; a synchronous call between two services that holds a connection open, a Horizontal Pod Autoscaler policy left at its default thresholds, an EBS volume that outlived the instance it was attached to. None of it triggers an alert on the day it ships. It accumulates, quietly, until it is large enough to show up as a line item.
This matters more today than ever. According to Flexera, cloud waste rose to 29% of IaaS and PaaS spending in 2026, the first increase in five years. Idle compute, over-provisioned managed database tiers, and unattached block storage make up the bulk of it, with AI workloads, GPU-backed inference nodes billed hourly whether serving traffic or not, and growing multi-region, multi-service topology as major contributors. It isn't that engineering teams got less disciplined. Architectures accumulated moving parts faster than the cost practices tracking them.
1. What Is a Cost Signature?
A cost signature is the distinct spending pattern a design decision leaves on a cloud bill. Just as a specific exception type and call stack reveal a familiar coding mistake, a specific shape in the cost curve, a plateau, a step function, a linear climb, points back to a specific architectural or operational decision. Correlate a signature to its cause a few times and it becomes as recognizable as a null pointer dereference.
Different layers of the system leave different signatures, and each one has a distinct billing mechanism behind it:
- Architecture pattern: Frequent, synchronous service-to-service calls drive up cross-AZ transfer charges, since traffic crossing an Availability Zone boundary traverses a metered backbone link while intra-AZ traffic typically doesn't, and leave compute idle while threads block on I/O. A monolith concentrates cost differently: fewer, larger instances, less inter-service overhead, but a harder ceiling on horizontal scale-out.
- Deployment pattern: A blue-green cutover needs close to double the steady-state capacity during the transition window, since both environments run in parallel until traffic fully shifts. A canary needs target groups and traffic-splitting rules to route live traffic to the new version, standing infrastructure that exists purely to de-risk a deploy.
- Scaling strategy: A fixed-capacity environment produces a flat cost curve. Autoscaling tuned against the right signal, latency or queue depth rather than raw CPU, tracks traffic closely. Tuned against the wrong signal, or too conservative a cooldown, it ratchets up on every spike but rarely fully releases.
None of these patterns is inherently wasteful, each just leaves a different signature. Even tooling choice shapes it: a query engine with no dry-run cost estimate, no bytes-scanned preview before execution, can let an analytical query silently scan an entire unpartitioned table instead of a filtered slice, because the query planner has no cost-based guardrail stopping it.
2. What Are the Most Common Cost Signatures?
Some patterns recur across engineering teams because they emerge from defaults, not mistakes. Catching them in a design review costs nothing; reconstructing them from a bill months later costs a full investigation. Five patterns cause most of the surprises:
| Pattern | What it looks like | Signature it leaves |
|---|---|---|
| Poor autoscaling configuration | Conservative utilization thresholds, or scale-down cooldowns left at default, often five to fifteen minutes. | Compute spend stays high after traffic drops—a plateau instead of a curve that tracks the request graph. |
| Orphaned infrastructure | Volumes, load balancers, or snapshots left behind after a workload is decommissioned without a matching teardown step. | Small, recurring line items absent from any capacity plan; hourly and per-GB-month charges that persist indefinitely. |
| Inefficient workloads (N+1 queries, over-provisioned instances) |
Query patterns or instance sizes chosen for convenience over measured need, with no index review or load testing against production data volume. | Database CPU and I/O costs scaling faster than request volume or business growth. |
| Architectural weaknesses (chatty cross-service calls) |
Many small synchronous calls, often crossing Availability Zone boundaries, with no batching, caching, or async layer absorbing them. | Higher inter-AZ transfer charges plus compute idle on network round trips. |
| Operational blind spots (no ownership mapping) |
Resources provisioned without owner or cost-center tags enforced at creation time, with no tag policy blocking untagged launches. | Spend nobody feels accountable for, so it persists without ever surfacing in a review. |
3. Why Does Poor Autoscaling Show Up as a Plateau, Not a Spike?
Poorly configured autoscaling leaves a subtle signature: a plateau, not a spike, easy to miss on a dashboard tuned for short anomalies rather than sustained drift.
This happens when a cooldown period keeps replica count high past the point demand dropped, a deliberate tradeoff to avoid flapping, or when the scaling metric stops correlating with load, CPU on a memory-bound workload, for example. A Horizontal Pod Autoscaler scaling on CPU alone won't scale down a memory-constrained service, so replica count, and the bill behind it, stays inflated on a metric that was never the real constraint.
The fix is rightsizing; comparing trailing utilization, typically a p95 or p99 percentile over a rolling window, against provisioned capacity, then downsizing where sustained usage doesn't justify the allocation. Every major cloud provider now ships a rightsizing engine built on exactly this analysis, evidence that over-provisioning is closer to default than exception.
4. What Does a Chatty Architecture Cost?
A service is chatty when call volume between it and its dependencies grows faster than the business logic justifying it, often because a single request fans out into a dozen synchronous downstream calls. That pattern consumes inter-service bandwidth and leaves compute idle while a thread blocks waiting on a response.
Consider a team running small microservices calling each other over synchronous HTTP or gRPC, with no batching, caching, or queue absorbing bursty traffic. This raises cost three ways: cloud providers meter cross-AZ transfer per gigabyte, so growing call volume compounds that charge, and faster under a retry policy with no backoff; instances spend cycles blocked on network I/O so CPU looks busy while throughput per dollar drops; and every synchronous dependency adds a cascading-failure point without a circuit breaker isolating the blast radius.
The fix set is consistent; consolidate tightly coupled services back into fewer, coarser-grained deployables; introduce batching, caching, or an async queue to absorb bursty calls; and add circuit breakers so one degraded dependency can't cascade its latency, and its cost, across the request path. None of this makes microservices inefficient by design, the problem is specifically when call volume outgrows what the topology and connection pooling were built to absorb.
5. What Do Inefficient Queries and Orphaned Resources Cost?
Both are worth naming precisely because their signatures are quiet, a steady drip rather than a spike.
A classic example is the N+1 query pattern: instead of a single joined query, code fetches a list, then issues one additional query per row, missing the index or JOIN that would collapse it into one round trip.
Ten orders become 11 queries, five hundred become 501. The result compounds under concurrency: higher database CPU and I/O, connection pool exhaustion, longer query times, and a database instance provisioned larger than the schema and indexing strategy should have required.
Orphaned infrastructure leaves an even quieter signature: unattached volumes left behind after an instance terminates with no lifecycle policy, load balancers with zero healthy targets still billing hourly, snapshots retained past any documented policy, and reserved but unassociated IPs. The problem compounds when tagging isn't enforced at provisioning, through a tag policy or an infrastructure-as-code lint rule. A resource with no owner tag is a resource no cleanup process will ever flag.
6. Why Does Cost Literacy Belong on the Engineering Team?
Engineering cost awareness works best inside the same feedback loop as the decisions that create it, not in a finance report that arrives weeks after the spent posts. The engineer who set the autoscaling threshold or chose the query pattern is best positioned to recognize when it no longer matches production reality.
In practice, cost-aware engineering means:
- Owning architectural decisions: periodically re-reviewing scaling policies and communication patterns against current traffic, not the assumptions made at design time.
- Providing real-time cost visibility: seeing the cost delta of a deployment within hours, ideally in the same dashboards used for latency and error rate, not a monthly billing export.
- Treating cost as an engineering metric: tracked alongside p99 latency and throughput, since a cost regression signals system efficiency the same way a latency regression does.
This mindset forms the foundation of FinOps culture, distributing accountability for spend across engineering, finance, and operations instead of treating cost as a quarterly finance exercise. The FinOps Foundation's own maturity model frames it as a progression from basic visibility to engineers making cost-aware tradeoffs as normal design work, not a governance layer bolted on afterward.
The easy savings, an unattached volume here, an idle dev instance there, get found quickly by any basic audit. What's left requires reading the subtler signatures embedded in everyday decisions, which takes a team that understands how its systems generate cost, not just how they perform.
7. How Do You Read a Cost Spike?
Detecting a cost spike is rarely the hard part. Most cost monitoring platforms run statistical anomaly detection against a rolling baseline, using techniques like seasonal decomposition or a standard-deviation threshold, and flag a deviation automatically. The harder part is diagnosing why, and routing it to the engineer who can act on it, according to industry reporting.
A stack trace doesn't just report that an exception occurred, it reveals the exact call path that produced it. A cost anomaly deserves the same treatment: don't stop at the number on the bill, walk it back through activity logs, deployment history, and tag data to the decision that produced it.
Cost Spike Investigation Checklist
- Identify the pattern's shape: A spike, a plateau, and a step increase point to transient load, a stuck resource, and a provisioning change, respectively.
- Narrow it to a workload: A cost allocation report broken down by tag, account, or resource type should isolate the anomaly to a single service within minutes.
- Cross-reference deployments and config changes: Check CI/CD logs and infrastructure-as-code history for anything landing in the same window as the inflection point.
- Compare utilization against provisioned capacity: Low CPU or memory on an oversized instance class points to over-provisioning, or a policy scaling on the wrong metric.
- Inspect network traffic patterns: A data-transfer jump next to a flat compute line, visible in VPC flow logs, usually means chattiness across Availability Zone boundaries.
- Verify resource ownership: A missing owner tag, or one pointing to a team that no longer exists, signals orphaned infrastructure.
- Trace the decision behind the resource, not just the resource itself: Ask which choice produced it, and whether it still matches today's traffic and scale.
Practiced enough, this becomes the same pattern recognition engineers already apply when debugging a stack trace. The number on the bill stops looking arbitrary, it becomes the traceable output of a specific engineering decision, the same way a p99 latency graph traces everything upstream of it.
8. How Does Clouds Analytics Make Cost Signatures Visible?
A cost signature is only as complete as the trace it's read from. A distributed trace that stops at a service boundary hides exactly the downstream call that mattered. A cost signature scattered across three separate billing consoles has the same blind spot: the AWS side shows a spike, the Azure side shows nothing unusual, and the Kubernetes cluster, billed through whichever cloud hosts it, never gets checked at all.
Clouds Analytics closes that gap the way a unified trace closes a debugging gap, correlating cost against the same P95 and P99 latency signals engineers already watch, so a fix never gets made blind to its performance impact. It's built to complement native cloud billing tools, not replace them:
- Global Inventory connects to AWS, Azure, and Google Cloud through a read-only, agentless integration, no host credentials, and normalizes resource metadata into a single queryable surface in about two minutes.
- Access Control & Governance maps every resource in that inventory back to the IAM identity or team responsible for it, filling in the ownership frame that orphaned infrastructure usually hides.
- Resource Scheduler acts on what that combined view surfaces, applying stop and start schedules to idle and non-production resources based on observed utilization and performance data, so a schedule won't fire against a workload still under real load, cutting idle cloud spend by up to 65%.
Every pattern this piece has walked through, an autoscaling policy stuck at default, a chatty service crossing an Availability Zone boundary, a volume nobody tagged, produces a signature that's readable the moment cost, ownership, and performance data sit in one place instead of three.