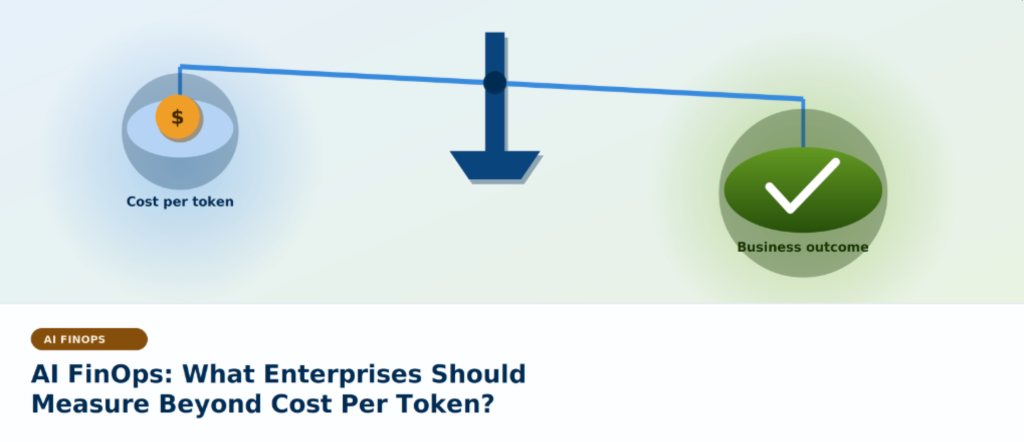
AI spend does not explain itself. AI FinOps fixes that with five numbers: cost per workflow, value per feature, ROI by use case, adoption versus outcomes, and refinement spend share. Each one ties spend to an outcome rather than a token count.
Key Takeaways
- Cost per token measures unit price. Value metrics show whether that spend paid off.
- 98% of organizations now manage AI spend in some form, but only 26% have real-time cost visibility, per KPMG.
- AI FinOps adds a value layer on top of cost visibility, the same shift cloud FinOps made once before.
- Agentic workflows resend the full accumulated context at every step, so token use can run far above standard chatbot use for the same task.
- A pricier model can cost less per resolved outcome, if it succeeds more often on the first attempt.
- Five scorecard metrics round out cost per token: cost per workflow, value per feature, ROI by use case, adoption vs. outcomes, refinement spend share.
- Uber capped AI coding tool spend at $1,500 per employee per tool a month, after its entire 2026 AI budget ran out in about four months.
- A named owner and a spend ceiling turn AI cost governance from reactive to proactive.
Why Is Cost Per Token Not Enough on Its Own?
Cost per token answers one question well: what a unit of model output costs right now. It does not show whether that output closed a ticket, drafted a usable contract clause, or moved the business forward. Two teams can report an identical cost per token and sit in opposite financial positions, one generating revenue per interaction, the other running a feature with little adoption.
Only 26% of enterprises have real-time visibility into what their AI systems cost to run, according to KPMG's Q2 2026 AI Pulse survey, even as 98% of organizations now report managing AI spend in some form, per the FinOps Foundation's 2026 State of FinOps report. Those numbers point to the same opportunity. Enterprises that build a value layer on top of basic cost tracking get ahead of the budget conversation instead of reacting to it.
How Do You Compare Two Models by Cost Per Outcome?
Model selection is where that gap shows up first, and it is the clearest entry point into model cost optimization.
Consider two vendors solving the same support automation problem for 1,000 monthly requests. Company A runs a premium model priced three times higher per token than Company B's budget model. Company A spends $18,000 upfront and resolves 900 tickets on the first attempt. Company B spends $6,000 upfront and resolves only 400.
The unresolved tickets still need an answer, so they escalate to a human agent at roughly $25 per escalation. Company A's 100 escalations add $2,500, for a total of $20,500. Company B's 600 escalations add $15,000, for a total of $21,000.
One formula settles the comparison: cost per resolved ticket equals total spend divided by tickets resolved. Company A comes out to $20.50 per ticket. Company B comes out to $21.00 per ticket. Judged by outcome instead of sticker price, Company A's higher per-token rate pays for itself.
| Metric | Company A (Premium Model) | Company B (Budget Model) |
|---|---|---|
| Upfront model spend | $18,000 | $6,000 |
| Tickets resolved first attempt | 900 | 400 |
| Escalation cost (@$25 each) | $2,500 | $15,000 |
| Total spend | $20,500 | $21,000 |
| Cost per resolved ticket | $20.50 | $21.00 |
How Is AI FinOps Different From Cloud FinOps?
Cloud FinOps built its discipline around cost visibility: which team owns which spend, which resource sits idle, which environment is over-provisioned. AI FinOps builds on that foundation and adds value visibility, on top of a cost structure that behaves nothing like a cloud invoice.
Why do agentic workflows use more tokens than expected?
Agentic workflows — AI systems that plan, call tools, and check their own output across several steps — do not draw tokens in a straight line. A single user request can fan out into a planning step, one or more tool calls, a self-critique pass, and a retry after a failed validation. Each step resends the accumulated context to the model.
Forbes reporting on enterprise agent economics describes per-task usage running orders of magnitude above simple chat, though it notes usage varies too widely between runs of the same task for one universal multiplier to hold. The direction is consistent even where the exact size is not: agentic mode costs more per task than chat mode, by a wide margin.
What Are the Five Metrics That Matter More Than Cost Per Token?
These five FinOps metrics do most of the work once cost per token stops being the headline number.
| Metric | Why it matters | How to calculate |
|---|---|---|
| Cost per workflow | Ties spend to a completed business process, not a raw token count | Total model and infrastructure spend for the workflow, divided by workflows completed |
| Value per feature | Shows whether a feature earns back what it costs to run | Revenue or cost saved from the feature, divided by feature spend |
| Adoption vs. outcomes | Shows which features are used heavily and which also move the business forward | Active users compared against completed outcomes over the same period |
| Token to spend drift | Catches a model swap or prompt change that quietly raises request cost | Current period cost per request, divided by baseline cost per request |
| Refinement spend share | Shows how much budget goes to retries and self-correction instead of the original task | Tokens spent on retries, re-prompts, and validation passes, divided by total workflow tokens |
How Do You Calculate Cost Per Outcome?
Cost per outcome is worth calculating separately for any workflow with a clear end state: a resolved ticket, an approved document, a completed booking. The formula is simple: total model spend divided by completed business outcomes.
For one support automation use case, total model spend for the month comes to $18,400 against 3,680 tickets resolved without escalation. That works out to $5.00 per resolved ticket, a far more useful number than any per-token rate on its own.
Note: Savings potential is not the same as savings realized. Caching, routing simple requests to a cheaper model, and trimming prompts only count once they show up on the actual invoice.
Who Should Own AI Spend?
Enterprise AI spend ownership usually sits across three teams at once: engineering owns the integration, product owns the roadmap, and finance owns the invoice after the fact. That structure works well for stable, predictable systems. Agents that fan out into dozens of calls per request need a tighter loop — only 26% of leaders report real-time cost visibility at all.
What Does Strong Auditability Look Like?
Strong auditability means more than a monthly export. It means knowing who can launch a new agent workflow, what spend ceiling triggers a review before the bill grows, and who gets notified when a single use case doubles its run rate in a week.
Uber built exactly this kind of tracking once its budget had already run its course. Compliance requirements around data handling raise the stakes further, since a clearly owned AI workflow is also a clearly owned audit trail.
How Do You Build an AI Cost Scorecard This Quarter?
None of this requires a new platform purchase to start. A one-page scorecard, reviewed monthly, does most of the work.
- List every active AI use case with its owning team and monthly spend.
- Attach one value metric per use case. Revenue influenced, cost avoided, or time saved, agreed with that team in advance.
- Track adoption against the outcome metric, not against raw usage.
- Flag token to spend drift over 15 percent for review before the next invoice.
- Review refinement spend share monthly. A workflow using more than a third of its tokens on retries usually has a prompt or tool-calling problem, not a pricing problem.
- Set a spend ceiling per use case that requires sign-off to cross, the way Uber eventually did per employee per tool.
Run that review for two quarters and the conversation with leadership changes shape. Teams walk in with a cost per outcome and a trend line instead of defending a token price.
How Does Clouds Analytics Make AI Infrastructure Spend Visible?
Model API spend is only half of the AI cost story. Every AI workload also runs on infrastructure: GPU instances for fine-tuning or self-hosted inference, Kubernetes clusters running the vector databases that power retrieval-augmented generation, and storage for the embeddings those databases search against. A lot of recoverable spend sits at this layer, and it is often the easiest to reclaim.
A GPU development instance started for a Friday afternoon experiment can keep billing all weekend if nobody remembers to stop it. Multiply that across a few dozen engineers, and idle infrastructure adds up faster than any single model bill.
Clouds Analytics gives infrastructure teams that same level of control:
- Global Inventory spans AWS, Azure, and Google Cloud in one view.
- A dedicated Kubernetes Cost view tracks clusters running inference and retrieval pipelines.
- Resource Scheduler applies stop and start schedules to non-production workloads automatically, cutting idle spend by up to 65 percent.
None of that replaces a model-level FinOps scorecard, but it clears the infrastructure waste sitting underneath one, so whoever owns that scorecard works from clean numbers instead of a GPU line item nobody can explain.
Find the idle spend hiding in your AI stack
Connect Clouds Analytics in about 2 minutes — agentless and read-only.